


Supply Chain Mastery: Power BI’s Impact on Operations
This case study outlines the implementation of a transformative solution, the Power BI Supply Chain Dashboard, tailored to address critical challenges in the supply chain industry. With a focus on efficiency and customer satisfaction, this dashboard delivers real-time insights and comprehensive analytics. Through dynamic filtering, KPI monitoring, and trend visualization, the solution empowers proactive decision-making and strategic planning. The study showcases challenges, the implemented solution, key dashboard features, resulting benefits, and the overall impact on optimizing supply chain operations for the client.
Summary
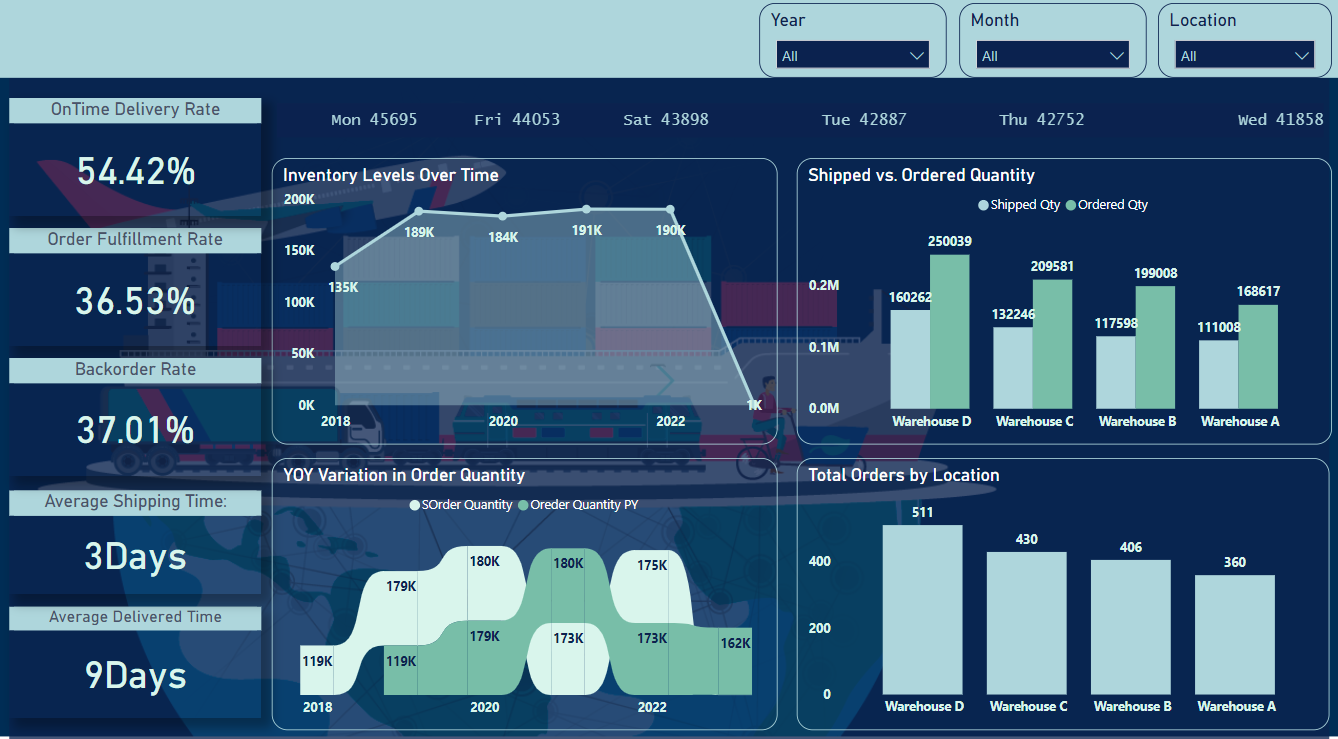
The Power BI Supply Chain Dashboard presents real-time insights into critical supply chain metrics. Users can dynamically filter data by location, year, and month, monitor key performance indicators (KPIs) such as on-time delivery and order fulfillment rates, analyze delivery trends, compare warehouse performance, and strategize based on year-to-year order analysis. The dashboard enables proactive decision-making, optimizing inventory levels, and improving overall operational efficiency.
About the Customer
Our customer is a dynamic organization operating in the supply chain industry, managing multiple warehouses to meet the demands of their diverse clientele. With a focus on efficiency and customer satisfaction, they sought a comprehensive solution to visualize and analyze their supply chain performance.
The Challenges
The customer faced challenges in tracking and optimizing their supply chain operations. They needed a tool to provide real-time insights into inventory levels, order fulfillment, and delivery timelines across various locations. Challenges included managing on-time deliveries, order fulfillment rates, backorders, and gaining a holistic view of their supply chain performance.
The Solution
To address these challenges, we implemented a robust Power BI Supply Chain Dashboard. The dashboard incorporates three dynamic slicers for Location, Year, and Month, allowing users to filter data and focus on specific aspects of their supply chain. A scroller displays weekly delivery performance, and four key performance indicator (KPI) cards provide at-a-glance insights into on-time delivery rate, order fulfillment rate, backorder rate, average shipping time, and average delivery time.
Key Features
- Dynamic Filtering: Easily filter and dissect data with interactive slicers for Location, Year, and Month, tailoring the dashboard to specific needs.
- Delivery Trends Overview: Track weekly delivery performance trends with the scroller, providing a dynamic overview of delivery patterns and identifying peak and low periods.
- Key Performance Indicators (KPIs):
- Timely Delivery Monitoring: Keep an eye on the percentage of on-time deliveries, ensuring a high level of service reliability.
- Order Fulfillment Efficiency: Evaluate the efficiency of order processing by monitoring the percentage of orders successfully fulfilled.
- Backorder Management: Identify and manage instances where demand exceeds available inventory, reducing backlogs.
- Shipping Time Analysis: Gauge the efficiency of the shipping process by assessing the average time it takes for orders to be shipped.
- Delivery Time Analysis: Measure the average time from order placement to delivery, providing insights into the overall fulfillment timeline.
- Inventory Trends Visualization: Use the Area Chart to visualize inventory levels over time, identifying patterns, seasonality, and areas for optimization in managing stock levels.
- Warehouse Performance Comparison: Compare the total quantity of shipped items against ordered items for each warehouse with the Cluster Column Chart, aiding in assessing warehouse-specific performance and demand patterns.
- Year-to-Year Order Analysis: Analyze the trend in total order quantity for the current year compared to the previous year with the Ribbon Chart, providing insights into business growth.
- Geographical Order Distribution: Explore the distribution of total orders by location with the Bar Chart, enabling a geographical understanding of demand patterns and allowing for targeted resource allocation.
The Outcome
The Power BI Supply Chain Dashboard has empowered our customer with actionable insights into their supply chain operations. By monitoring key metrics and trends, they can make informed decisions to enhance efficiency and meet customer expectations consistently.
Key Benefits of Our Solution
- Real-time Visibility: Gain instant insights into supply chain performance.
- Proactive Decision-Making: Anticipate and address challenges with timely data.
- Improved Customer Satisfaction: Enhance on-time deliveries and order fulfillment rates.
- Efficient Resource Allocation: Optimize inventory levels and reduce backorders.
- Performance Benchmarking: Compare performance across warehouses and time periods.
- Strategic Planning: Use historical data for informed strategic decision-making.