


Resolving Grievances: Leveraging Data for Enhanced Consumer Satisfaction
Our Consumer Complaints Power BI Dashboard is tailored to tackle the complexities of diverse complaints and regulatory compliance in consumer relations. This case study explores how data analytics drives informed decisions, proactive issue resolution, and regulatory adherence. By offering a comprehensive view of complaint data, it empowers organizations to efficiently address consumer concerns, fostering a consumer-centric approach. This transformative tool enhances satisfaction and enables proactive issue resolution, shaping a more responsive consumer environment.
Summary
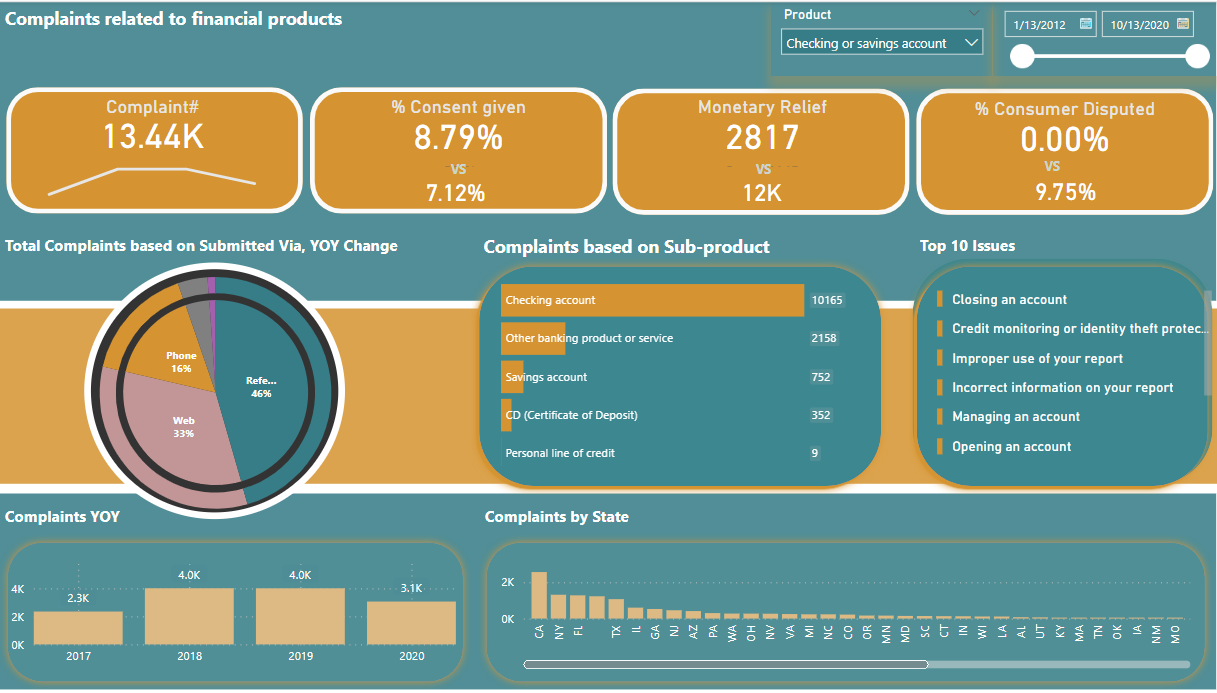
Our dashboard begins with a snapshot of the overall complaint landscape. The “Total Complaints” card presents the total number of complaints, offering a quick glance at the volume of consumer feedback. We further explore the distribution of complaints based on submission channels, visualized in the “Submitted Via Distribution” pie chart. Additionally, the “Sub-product Distribution” column chart breaks down complaint counts for each sub-product, providing a detailed understanding of the diverse range of issues reported.
About the Customer
The customer is a prominent financial services provider specializing in an extensive range of financial products tailored to meet consumer needs. Their offerings encompass a wide spectrum, including credit cards, debit cards, various bank account services, as well as loans and mortgages. With a dedication to serving their clientele with integrity and efficiency, the company is diligently delving into the analysis of customer complaints specifically related to these financial products.
Challenges
Addressing consumer concerns comes with its own set of challenges. These challenges include understanding the diverse nature of complaints, ensuring regulatory compliance, and identifying areas for improvement. Our dashboard aims to tackle these challenges head-on by providing a consolidated view of complaint data and facilitating a more streamlined resolution process.
Solution
To address these challenges, our Consumer Complaints Power BI Dashboard serves as a robust solution. Key features include the “Top 10 Issues” multi-card, which focuses on prioritizing key concerns, and the “Year Over Year Complaint Trends” bar chart, enabling organizations to track patterns over time. The dashboard empowers teams to make informed decisions, streamline issue resolution, and enhance overall consumer satisfaction.
Key Features
Total Complaints Card: Provides an overview of the total number of complaints.
• Consent Percentage Card: Illustrates the percentage of consent given out of the total complaints.
• Total Monetary Relief Card: Displays the total monetary relief associated with the complaints.
• Consumer Dispute Percentage Card: Represents the percentage of consumer disputes.
Outcome
The outcome of utilizing this dashboard includes enhanced visibility into consumer feedback, improved regulatory compliance, and the ability to proactively address emerging issues. Organizations can make data-driven decisions, prioritize areas for improvement, and foster a more responsive and consumer-centric environment.
Key Benefits of Our Solution
1.Informed Decision-Making: Access to real-time, visualized data empowers organizations to make informed decisions and prioritize areas for improvement.
2.Proactive Issue Resolution: By identifying top issues and trends, organizations can proactively address concerns, reducing the likelihood of escalated complaints.
3.Regulatory Compliance: The dashboard aids in ensuring regulatory compliance by providing a clear overview of consent percentages and other compliance-related metrics.
4.Efficient Resource Allocation: Organizations can allocate resources more efficiently by focusing on key issues and areas with the highest impact on consumer satisfaction.
5.Geographical Insight: The state-wise distribution chart provides geographical insights, helping organizations tailor solutions to specific regions.