


Paginated Reports in Power BI
Paginated reports are a crucial part of Power BI’s reporting functionality. These reports allow you to create printable, pixel-perfect reports with ease. Paginated reports are especially useful when creating documents for regulatory compliance, legal filings, or for printing financial statements. In this blog, we’ll discuss what paginated reports are, their benefits, and how to create them in Power BI.
What are Paginated Reports in Power BI?
Paginated reports are structured, highly formatted reports designed for printing and sharing. They are ideal for creating high-quality reports that require specific page layouts, such as invoices, legal filings, and financial statements.
Unlike other types of reports in Power BI, paginated reports are not interactive, and you cannot slice or filter data in real-time. Instead, they provide a fixed view of your data in a print-ready format. You can generate these reports from a range of data sources, including Power BI datasets, SQL Server, Oracle, and many more.
Benefits of Paginated Reports
Paginated reports offer several benefits that make them a valuable addition to your reporting arsenal:
- Pixel-Perfect Formatting: Paginated reports allow you to create precise, pixel-perfect reports with ease. You can adjust page layouts, add tables, charts, and graphs, and control every aspect of the report’s appearance.
2. High-Quality Printing: Paginated reports are designed for printing, meaning that they are optimized for high-quality print output. You can export your report to PDF, Excel, or Word and share it with your stakeholders with confidence.
3. Compliance and Legal: Paginated reports are perfect for compliance and legal filings, where specific layouts and formatting requirements are necessary. You can create reports that meet regulatory standards, making the report creation process more streamlined and efficient.
Creating Paginated Reports in Power BI
To create a paginated report in Power BI, follow these steps:
Step 1: Create a Paginated Report in Power BI Report Builder To create a paginated report, you first need to download and install Power BI Report Builder. Once you have installed the software, launch it and create a new report.
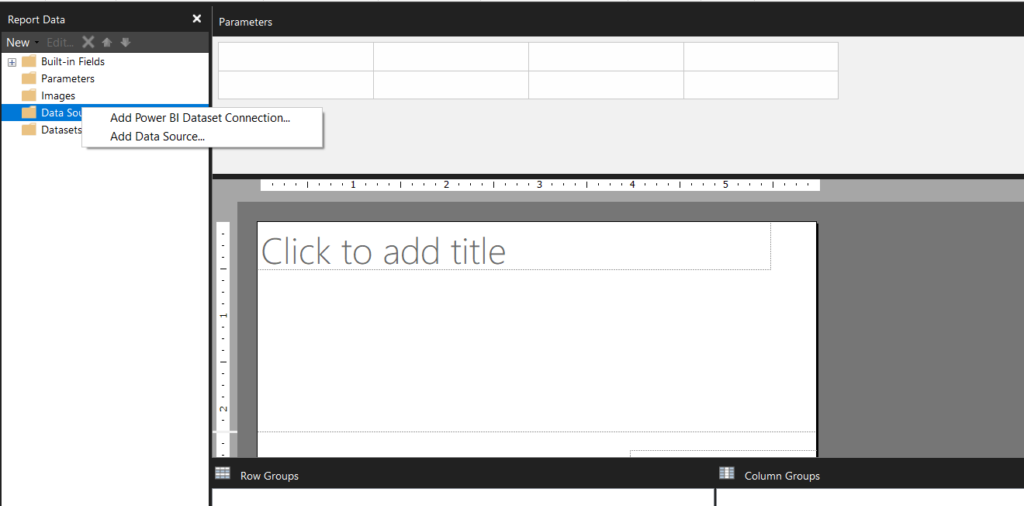
Step 2: Connect to Data Next, connect to your data source, such as a SQL Server database or Power BI dataset. Power BI Report Builder supports a wide range of data sources, so you can choose the one that works best for you.
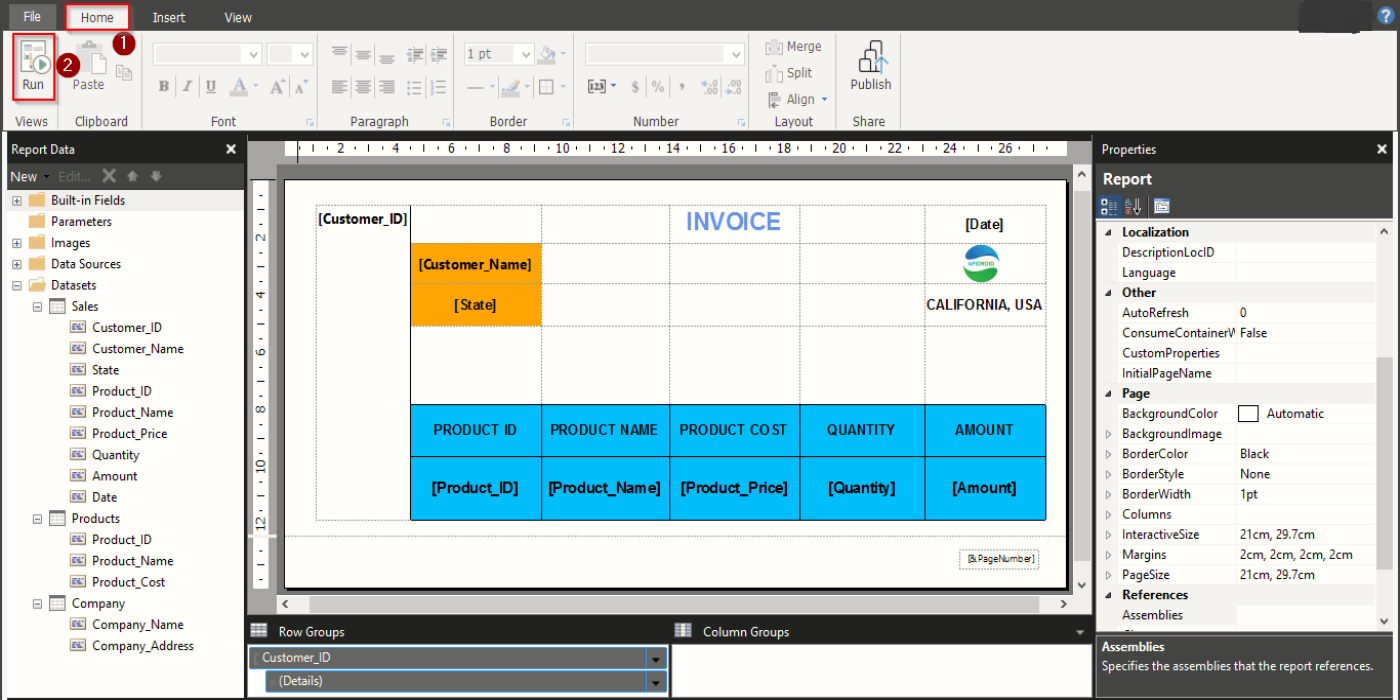
Step 3: Design Your Report Once you have connected to your data, you can start designing your report. Use the drag-and-drop interface to add tables, charts, and other elements to your report. You can also format your report by adjusting font sizes, colors, and styles.

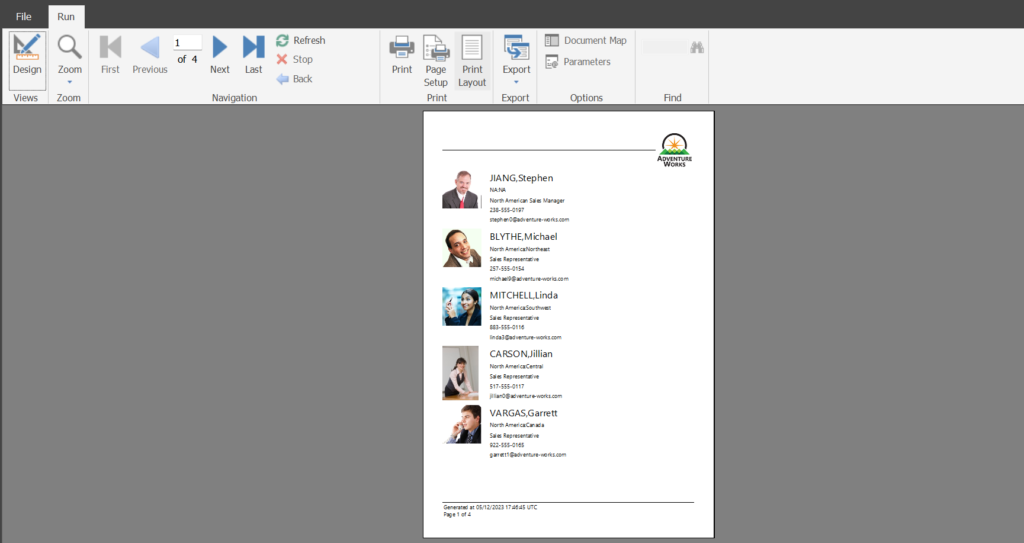
Step 4: Preview and Publish Your Report After designing your report, preview it to see how it will appear in the final output. You can also export your report to PDF, Excel, or Word format for sharing.
Conclusion
Paginated reports are an essential part of Power BI’s reporting functionality. They allow you to create pixel-perfect, print-ready reports that meet regulatory compliance standards. With Power BI Report Builder, creating paginated reports is easy, and you can connect to a range of data sources, making it the perfect tool for creating high-quality reports quickly and efficiently.